The screen showed two areas of the same field, only about 50 meters apart.
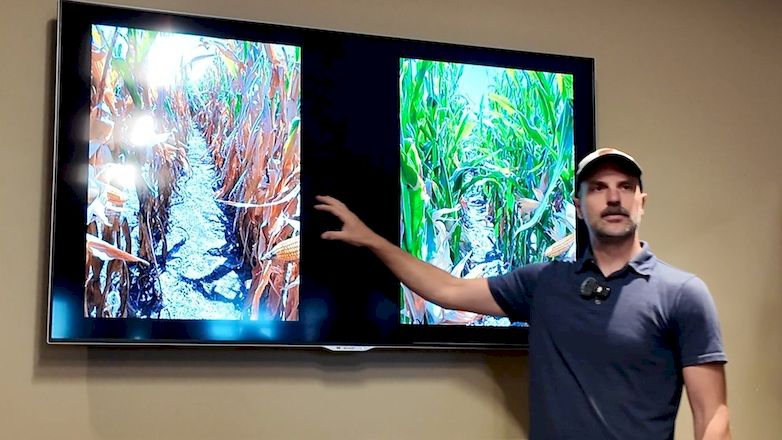
The same hybrid, the same planting date, and the same nitrogen rate. Yet the yields were completely different.
During a visit to Veris in Kansas, a company representative asked us to identify the reason for this difference. The weather was the same, and so were the management practices. The only variable left was the soil.
But what exactly was different about it?
A yield map shows where more was harvested and where less was harvested. It does not explain why. A standard soil test may not provide the answer either, especially if samples are taken only from the surface layer.
What the Top 15 Centimeters Don’t Reveal
At Veris, we were shown long soil cores collected in different states. They were laid out horizontally so that the entire profile could be examined.
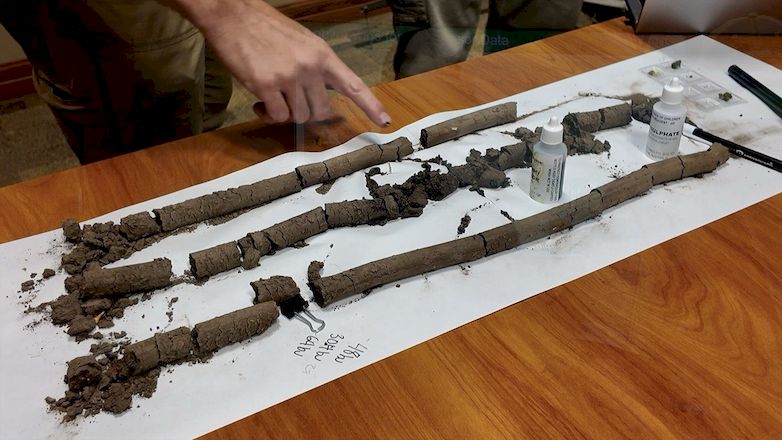
At the surface, some of the samples looked almost identical. If only the top 15 centimeters had been tested, the main difference might have gone unnoticed.
A little deeper, however, the profiles told completely different stories.
In one core, the topsoil ended quickly. In another, it extended much deeper. In some cases, the topsoil was two to four times thicker. Beneath it might be sand that loses water quickly or dense clay that restricts root growth.
None of this is visible from the surface. The difference becomes apparent in the condition of the crop, especially when moisture begins to run short.
Taking more samples can help. But even grid sampling at one sample per hectare may not capture the full extent of soil variability. Soil changes not only across a field but also with depth.
That was when I heard the comparison that stayed with me most: a “soil MRI.”
A Three-Dimensional View of the Field
A medical MRI helps reveal what is hidden inside the body. Veris equipment works on a completely different principle, of course, but the analogy is surprisingly apt.
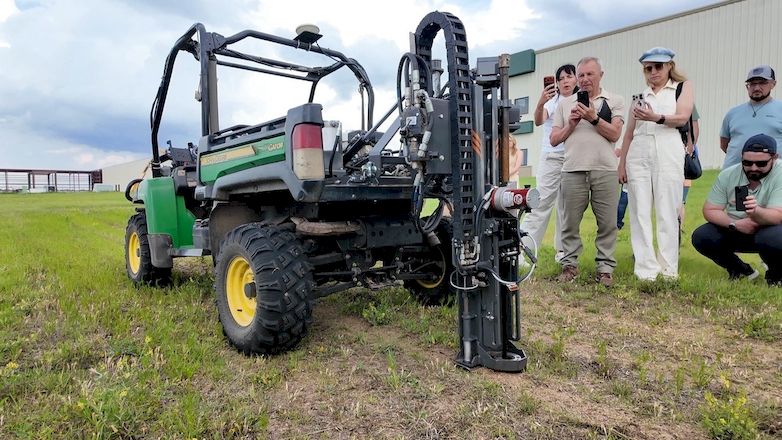
Sensors are inserted into the ground and take readings at different depths. They measure soil texture, moisture, organic matter, and resistance, which is used to assess compaction. Every measurement is linked to precise coordinates.
One of the systems pushes its sensors to a depth of about 60 centimeters. The result is more than a flat map of the field. It provides a cross-sectional view of the soil profile.
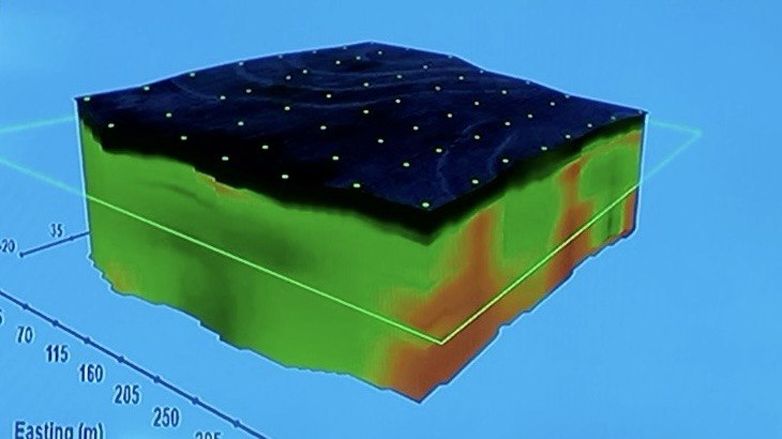
It becomes possible to track where the topsoil ends, how the proportion of sand and clay changes, where moisture is retained, and at what depth a compacted layer appears.
What once could be seen only in an individual soil pit can now be mapped across an entire field.
What the Sensors Revealed
The president of Veris demonstrated the equipment in the field. The vehicle remained stationary while the system was operated manually. Using a tablet, he lowered the sensor assembly into the soil, and the readings immediately appeared on the screen.
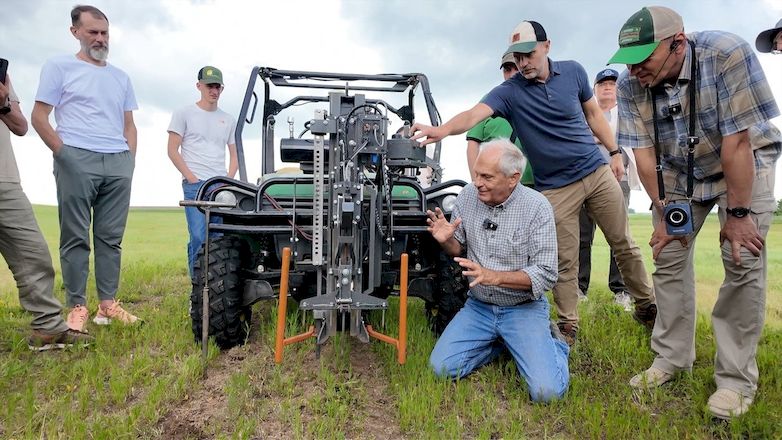
Near the surface, the soil was dry and sandy. Deeper down, the sensors reached clay that held considerably more moisture. The change between the layers was immediately visible in the graphs.
A single location, yet several distinct soil layers beneath it.
What impressed me most was not even the depth of the survey, but how much ground the equipment could cover.
In normal field operation, the process is automated. Each time the vehicle stops, the system lowers the sensors, takes the measurements, and georeferences the results. The driver does not have to leave the vehicle and repeat the process manually at every location.
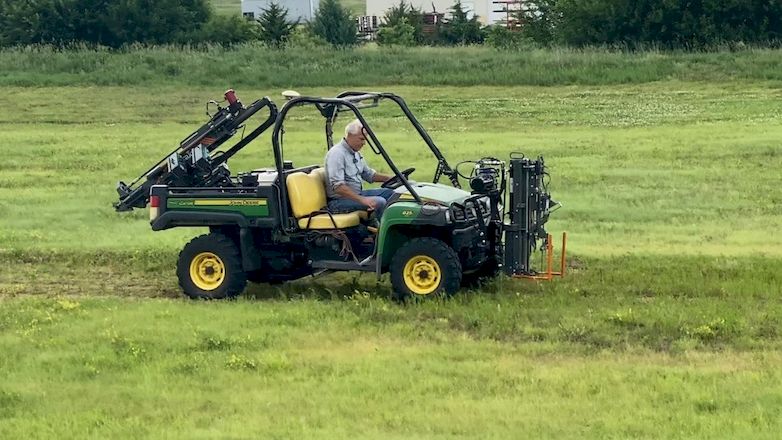
With four measurements per hectare, the equipment can survey approximately 20–24 hectares per hour.
This is no longer a matter of using a few isolated points to represent an entire field. Data can be collected across a large area while also revealing how the soil changes with depth.
Seeing the Problem Is Not the Same as Solving It
The technology is impressive. But during the explanation, one comment put all the sensors and graphs into perspective:
“The key is interpreting the data. What do we do with it next?”
If yields are lower because of a nitrogen deficiency, that is one situation. If the cause is shallow topsoil, sand beneath it, or low water-holding capacity, applying more fertilizer may make little difference.
Compaction must also be located and understood before any decision is made. It does not necessarily form one continuous, uniform layer beneath the entire field.
The data can be used for variable-rate seeding, fertilizer and lime applications, irrigation planning, or more targeted laboratory sampling. But the final judgment still rests with the farmer and the agronomist.
A medical MRI does not cure a patient. It helps identify the problem more accurately.
Perhaps soil scanning should be viewed in the same way. The equipment will not improve the soil or tell an agronomist which decision is right. It simply reveals what is hidden beneath the field’s surface.
Only then can a decision be made about whether something needs to change and, if so, what.
The video shows the Veris equipment during the field demonstration, along with the readings displayed on the tablet as the sensors enter the soil.